Imagine embarking on the journey of writing front-end code, where initially, everything appears flawless. Upon running the application, however, one is met with disappointing red warnings. This moment often leads to discouragement, tempting some to consider giving up. Yet, it marks the perfect opportunity to delve into Frontend Debugging. Confronting issues in front-end code is a call to understand the root causes of these problems. Debugging opens a pathway to thoroughly learn about and understand these issues.
This article is crafted to guide readers through the process of debugging frontend code, highlighting tools and methods that quickly identify issues. From the utilization of browser developer tools to the application of automated testing frameworks, the techniques discussed here are designed to expedite the debugging process and significantly enhance the quality and reliability of code. Equipped with this knowledge, one is well-prepared to tackle any frontend challenge that may arise, transforming obstacles into opportunities for growth and learning.
What Are The Essential Frontend Debugging Techniques For Smooth Development?
To become more practical in front-end debugging, it is necessary to use debugging best practices. Here are the most common 3 front end debugging techniques:
- Using console
- Using browser developer tools
- Using Debugging Tools
1. Using Console:
In Using the Console debugging technique, developers write “console.log()” statements inside their codes to see the output of any variable or code part in the console.
How can Console.Log() Statements Be Used For Basic Debugging?
Console is where coders see the output of specific actions in the code. The “console.log()” is the statement that allows coders to show the result of what is written inside of the statement inside of the console.
This process is one of the important skills of front end developers should have and also the first answer to “how to debug frontend code”.
For example, a coder can inspect variables with the “console.log()” statement like this:
“let y = 7;
console.log(‘The y is : ’ , y);”
This piece of code will show in the console like “The y is : 7”.
Another example is to check function execution to see if it is working or being called or not like this:
“function sayHello(name) {
console.log(‘Hello ’, name);
}
sayHello(‘Michael’);”
In this set of code, we are calling “sayHello()” function, and we will see “Hello Michael” in the console.
To sum up, we can use “console.log()” to check if we are getting the correct variable or if the function is called correctly. After that, we can add more “console.log()” statements to check other stages of the code.
2. Using Browser Developer Tools:
In Using Browser Developer Tools technique, you right-click on the browser and select inspect to see browser developer tools opening. There are a lot of features, like console and network activity, which will help debug our code.
3. Using Debugging Tools:
Using debugging tools is another common front-end debugging technique. There are options for setting breakpoints in your code while using IDEs like VSCODE or IntelliJ. These tools allow you to see your code step-by-step.
What Are Breakpoints, and How Can They Help In Pausing Code Execution?
Breakpoints are markers that tell the debuggers to stop at that point and help debug the frontend. Normally, the whole code executes when the coder runs the application, but with breakpoints, coders can put some steps before final execution. Therefore, they can examine each step and identify the problem before the final execution.
Coders can set breakpoints directly by the code editor. Also, in most modern browsers, coders can set breakpoints by clicking the line number in the source code. Alternatively, they can use the “debugger;” statement in the JavaScript code.
When the execution of the code reaches the breakpoint, it will pause the code execution. At that point coders can inspect variables and try to understand any problem inside of it. After that, they have three options:
- “Step Into”: which moves to the next line of code and steps into function calls.
- “Step Over”: which moves to the next line without steps into function calls.
- “Step Out’’: continues execution until the current function returns.
How Can Step-By-Step Debugging Be Employed to Tackle Intricate Issues?
When coders face an error, they cannot understand the problem in the console. To solve the problem, they start with creating breakpoints. However, these breakpoints should be logical and might be before or after some important functions or variable definitions. Therefore, coders need to start debugging mode and go step-by-step on breakpoints. They use “Step Into”, “Step Over”, and “Step Out” methods to proceed. Also, they can inspect variables at any breakpoints. Finally, when they find a problem with this method, it would be wise to document it.
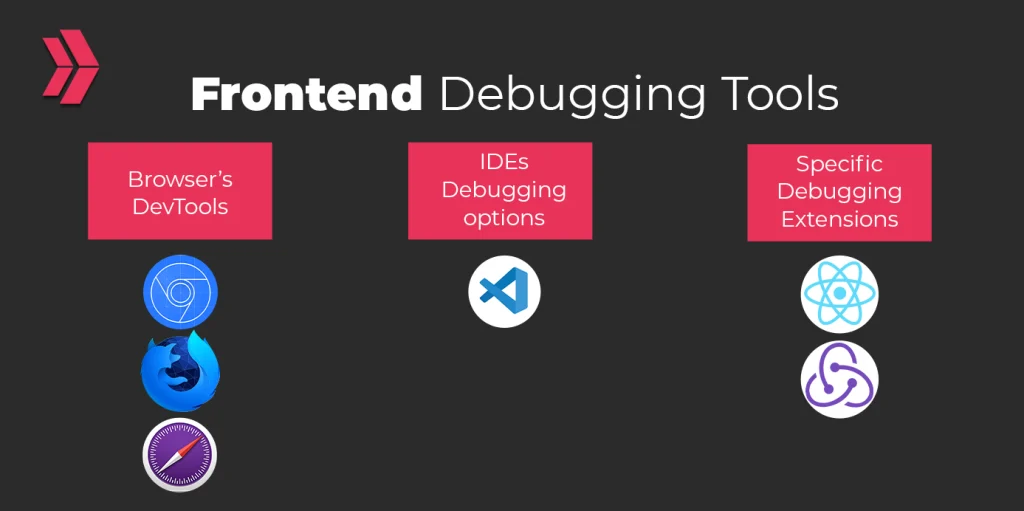
What Powerful Tools Can Be Explored For Frontend Debugging?
In terms of front-end debugging tools, there are 3 main categories: Browser’s DevTools, IDEs Debugging options, and Specific Debugging Extensions. Firstly, The most famous browser DevTools are Chrome DevTools, Firefox Developer Tools, and Safari Web Inspector. Secondly, the best IDE for frontend debugging is Visual Studio Code. Thirdly, the most popular extensions are React Developer Tools and Redux DevTools.
What Is Chrome DevTools, And What Are Its Debugging Features?
Chrome DevTools is a set of web developer tools built directly into the Google Chrome browser. It provides developers with a comprehensive suite of resources for debugging and optimizing websites and web applications. Here are some key features and uses of Chrome DevTools:
- Check HTML / CSS: Chrome DevTools allows examining both HTML and CSS. Additionally, coders can see the box model of the element with width and height. Also, it helps a lot in terms of styling.
- JavaScript Debugging: A specific JavaScript debugger is inside Chrome DevTools. It allows you to create breakpoints and go through a step-by-step analysis of the code.
- Network Operations: Chrome DevTools also clearly represents the application’s network operations. Coders can see what is coming or going out from your application. The operation would not have happened if the color red was used.
- Console: In the console, developers can see the result of “console.log()” statements, which will help debugging.
There are a lot more browser debugging tools for chrome, but these are the most used ones for debugging.
How can Visual Studio Code be leveraged for debugging frontend code?
Visual Studio Code has a couple of shortcuts and easy-to-understand UX visuals for debugging front-end code. First, coders need to set up their workspace and launch configuration. After that, they can set breakpoints by clicking the left gutter next to line numbers or pressing “F9”. Later, they can start debugging by clicking “F5”. Then, they will see the debug toolbar and its actions of it. All variables and options for extra actions will be seen there. This is the process of how to debug front-end code in visual studio.
What Are The Debugging Tools Available In Popular Browsers’ Developer Tools?
All modern web browsers have developer tools because these tools help to analyze and debug the application. Here are the most popular 4 browsers with developer tools:
- Google Chrome: Chrome DevTools with Elements, Console, Network, and more.
- Mozilla Firefox: Firefox Developer Tools with Inspector, Console, Network, and more.
- Microsoft Edge: Microsoft Edge Developer Tools with Elements, Console, Debugger, and more.
- Safari: Safari Developer Tools with Elements, Console, Debugger, and more.
What Are The Best Practices For Efficient Frontend Debugging?
Efficiency in frontend debugging is important because it saves time and increases productivity. Several practices help coders debug the frontend code more efficiently.
Firstly, developers need to understand the tools that they are using. For example, if they are using Chrome, they should know Chrome DevTools. Also, they need to learn how to use breakpoints and console logging.
Secondly, using version control is another best practice for efficient front-end debugging. It will help developers understand what changes caused the problem, and you can also revert changes to fix problems.
Thirdly, reproducing the issue is a practice for debugging the front end efficiently. Developers should ensure they can reproduce the problem again before debugging. Without knowing where to look, one cannot debug well.
Another important practice is writing test cases. Creating unit tests and integration tests helps keep an eye on the code and catch problems directly when there is a change in the code.
Finally, documenting the findings and sharing the insights with the team members solve future problems.
Why Is Error Handling and Logging Crucial In Frontend Debugging?
Error handling and logging are very important for both users and developers since these two methods allow them to identify issues, provide feedback to end users, and prevent application crashes. Error handling and logging also give opportunities for debugging, troubleshooting, monitoring, and maintenance for developers. In general, they improve user experience and also security for better applications.
How Can Unit Tests Be Implemented to Catch Bugs Early In The Development Process?
Unit tests are one of the best front end debugging techniques. It is an automated test to verify the behavior of code or components in the code. So, implementing it will allow developers to catch bugs early. To ensure, follow the steps below:
- Choose a Correct Testing Framework: Select a suitable test framework for the project, like Jest for JavaScript.
- Write Testable Code: Write the code in modules and ensure they are testable. Break the code into small parts.
- Write Test Cases: Write test cases that will cover most of the scenarios. It should cover both the positive and negative behavior of your code.
- Automate Testing: Set up CI ( continuous integration ) pipelines to run your code with automatic tests every time.
- Refactor and Improve: Use feedback from unit tests to refactor and improve your code.
What Are The Remote Debugging Tools That Facilitate Collaboration Among Team Members?
Remote debugging is important where the team of developers can collaborate. A couple of remote debugging options exist:
- Visual Studio Live Share, which allows developers to work on the same workspace.
- CodeSandBox, which is an online code editor.
- CodePen, which is also an online collaborative code editor.
- TeamViewer, which is remote desktop software.
Learn Frontend and Debugging With Clarusway!
Embarking on a journey to master frontend development and debugging skills can feel like setting sail into a vast ocean of code and complexity. Have you ever thought about what it takes to navigate these waters smoothly and reach the shores of success? This is where Clarusway comes into play, offering a beacon of light for aspiring developers.
Clarusway provides an immersive learning experience that bridges the gap between theoretical knowledge and practical application. With a front-end development course designed to cover everything from HTML, CSS, and JavaScript to the intricacies of debugging techniques, students are equipped with the tools needed to solve real-world problems. Imagine having the ability to not only write code but to also diagnose and fix issues with precision and confidence.
But why choose Clarusway for your learning journey? The answer lies in their commitment to student success, offering personalized mentorship, hands-on projects, and a community of learners and experts. This isn’t just about learning to code; it’s about becoming a well-rounded developer who understands the nuances of debugging and can tackle challenges head-on. Ready to transform your passion for technology into a thriving career? Join us at Clarusway and turn your dreams into reality, one line of code at a time.