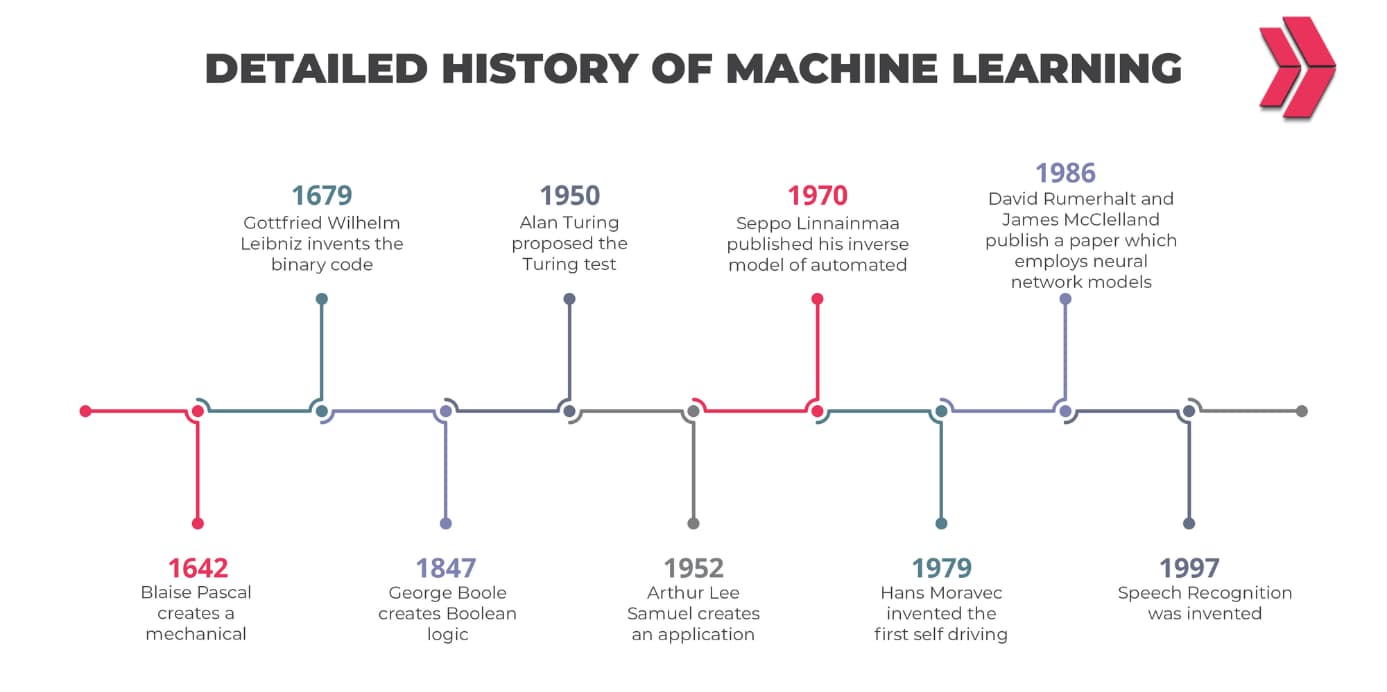
Have you ever thought of how you’ll be able to understand the behaviors, preferences, and opinions of the public easily via social media? Does one know the meaning of the internet of things (IoT)? Have you ever heard petabyte, exabyte, zettabyte, and yottabyte terms in your life? These terms are about the dimensions of the information. Let’s explain them. Let’s start from the start to the highest of knowledge size terms.
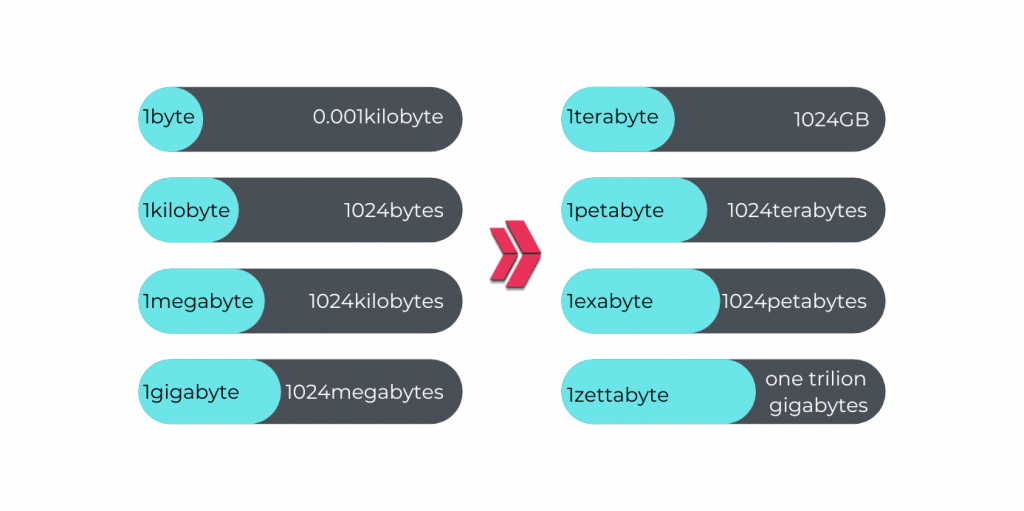
As the Internet era develops, we generate enormous data each moment. As a result, the amount of data floating around the internet is expected to reach 163 zettabytes by 2025. Patterns and correlations revealed by powerful analytics in massive data sets are informing planning and decision-making.
The Internet of Things (IoT) is a network of real-world objects with electronics, software, sensors, actuators, and network connections like furniture, cars, household appliances, and other things. Are you able to imagine these devices producing data? These examples are truly amazing and exciting.
As we all know, big data has arrived, and therefore the explosion of creativity that it brings can’t be overstated. Within the twenty-first century, everyone and everything is affected. As individuals, we contribute to big data by generating data from our computers, mobile devices, audio/video, networks, log files, transactional applications, web, and social media, yet as machine sensors of varied types embedded during a style of environments like hospitals, metro stations, markets, and virtually every device that generates data on a routine.
At least 53% of companies utilize big data to gain knowledge, save money, and boost profits. One of the most significant tech improvements of the digital era is big data. It affects almost every facet of our existence, including regular buying decisions and shopping behaviors. Today’s big data may become small data tomorrow. Let’s explain the definition of big data.
What is Big Data?
The term “big data” refers to big data analytics, data visualization, and the uses of big data techniques. It can be described as amounts of datasets that surpass a petabyte, i.e., equal to one million gigabytes or 1015 byte size. It is used centralized database architecture in traditional databases, and it is used distributed architecture.
So, what is the definition of big data? There are lots of definitions to explain the term “big data.” Big data definitions are generally used about “characteristics of datasets”, “structure of datasets”, “amount of datasets”, “using aims of datasets”, and “capacity of database”.
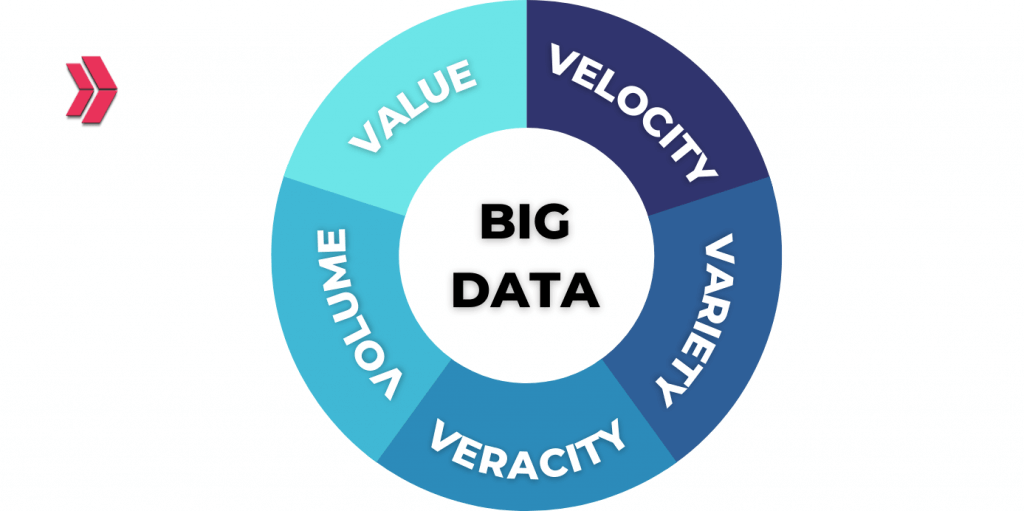
It can be described as characteristics of datasets that are immense in Volume (size/the amount of data managed), Velocity (rate of change/speed/ the rate of incoming data), and Variety (the caliber and correctness of the incoming data), which was also introduced by Doug Laney, a Gartner analyst, was one of the original data types that Laney initially recognized in research released in 2001, also added Veracity (the reliability and correctness of the data being received), Value and Variability.
Big data can be described as amounts of datasets that surpass a petabyte, i.e., equal to one million gigabytes or 1015 byte size, i.e., huge, complex, and high-velocity dataset. Recognized as more than one gigabit (1 GB) in size throughout the late 1990s and early 2000s.
According to some authorities, big data can be defined as three structures of datasets with an ample volume of structured, semi-structured, and unstructured data or as two structures of datasets as structured and unstructured.
Big data can be identified using the aims of datasets that are used in analyzing the past dataset to do future forecasting and reveal patterns, trends, and associations.
Big data is defined as the capability of a repository or big data management datasets whose volume or form surpasses that of conventional relational database systems to acquire, administer, store, and analyze the data quickly.
Characteristics or Vs. of big data
Is there any interesting thing in the heading according to you? Yeah! It’s written as “Vs. of big data”. All right, any idea what the V means? Let’s explain!
There are mainly three words that start with “V” to explain big data characteristics. These words are “volume”, “variety” and “velocity”. More recently, some other words starting with “V” have been included in the definition of big data. These words are “veracity”, “value” and “variability”. There are six words starting with “V” that explain the characteristics of big data totally. Let’s explain the meaning of the V’s;
- Volume means “the sum of data acquired from different sources”.
- Variety is simply another word for “types of data“. Data can be completely unstructured, partially structured, or structured.
- Velocity means the generated big data’s speed.
- Veracity means the degree to which big data can be trusted.
- Value means the business value of the data collected.
- Variability means a way of defining unpredictable data flow.
History of the Big Data
Background on Big Data In the 1950s, businesses used basic analytics on data in a spreadsheet that was manually analyzed to find trends and insights. People became aware of just how much data was produced by users via YouTube, Facebook, etc., around 2005. Hadoop was developed that same year, and Spark was developed in 2014 for analyzing big data.
Table-1: Big Data Phases
The origins of data analysis, which led to the development of modern big data analytics, may be traced back to London in the 17th century.
1663– Introduction to statistical data analysis by John Graunt.
1865– Richard Millar Devens first used the term “business” in 1865 to refer to the method of data analysis.
1881– The invention of the Hollerith Tabulating Machine signaled the start of the census data processing industry.
1926– Based on his comprehension of how wireless technology would transform particles, Nicola Tesla was able to foresee our present predilection for smartphones and other mobile electronics.
1928-The magnetic tape storage method developed by German-Austrian engineer Fritz Pfleumer served as the basis for video cassettes and movie reels, paving the path for the eventual storage of digital data.
1943-In order to analyze massive amounts of data, the U.K. developed a theoretical computer called Colossus. It was one of the earliest data processing tools to decipher Nazi codes during World War II.
1948– Shannon’s Information Theory is improved and serves as the foundation for widely used information framework today.
1959– Machine learning(ML) was first used by IBM programmer and artificial intelligence pioneer Arthur Samuel.
1965– The United States intends to construct the first data center facilities in order to preserve millions of tax records and fingerprinting magnetically.
1969– The foundation of the contemporary internet was laid in 1969 by the Advanced Research Projects Agency Network (ARPANET), the very first network hub to use TCI/IP standards and dispersed control.
1970– IBM mathematician Edgar F. Codd presents a “relational database” to show how information in sizable databases can be accessed.
1989-1990– Tim Berners-Lee and Robert Cailliau, who also designed HTML, URLs, and HTTP, founded the World Wide Web in 1989–1990.
1996– R.J.T. Morris and B.J. Truskowski reported(“The Evaluation of Storage Systems”) that digital data storage is becoming more cost-effective than paper storage.
1997– Google.com launched the search engine’s journey toward the development of machine learning, big data, and analytics.
1998– Carlo Strozzi creates NoSQL, a method for storing and retrieving data that differs from relational databases.
2001– Doug Laney introduced Volume, Variety, and Velocity (the 3Vs) in 2001 to describe the characteristics of big data. In the same year, the phrase “software-as-a-service” (SaaS) was first used.
2005– Doug Cutting and Mike Cafarella of Yahoo developed Apache High Availability Distributed Object-Oriented Platform (Hadoop), an open-source framework for storing and processing large data sets. Since then, big data analytics tools have undergone continuous improvement.
2006– 2006 is the year that Amazon Web Services (AWS) launches its cloud computing services.
2007– The phrase “big data” was originally used in 2007 by Wired in his article “The End of Theory: The Data Deluge Makes the Scientific Method Obsolete.”
2008– A team of computer science academics highlighted how big data is profoundly altering how businesses and organizations conduct business in their study, “Big Data Computing: Creating Revolutionary Breakthroughs in Commerce, Science, and Society.”
2010– People now produce as much information each day as they did from the beginning of civilization until 2003, according to Google CEO Eric Schmidt.
2014– The Internet of Things (IoT) became popular, with an estimated 3.7 billion connected devices every day. In the United States, mobile devices now outnumber desktop computers for the first time. Apache Spark was introduced.
2017– Only in the past two years has 90% of the world’s data been produced, and according to IBM, 2.5 quintillion bytes (18 zeros) of data is being produced daily.
2020– The market for big data and business analytics was estimated to be worth $193 billion in 2019 and is projected to increase to $420.98 billion by 2027 at an annual compound rate of growth of 10.9 percent, according to Allied Market Research.
2021– By 2025, we’re projected to have produced roughly 181 zettabytes of data (1 zettabyte = 1 trillion gigabytes), having already produced more than 79 zettabytes by 2021.
Who Uses Big Data?
Many major businesses embrace big data analytics to get relevant insights and make better-informed decisions regarding product strategy, sales, marketing, consumer service, and operations. Big Data technologies are extremely beneficial to businesses in terms of increasing efficiency and developing new data-driven services.
Big data is now an essential component of analysis and is needed to comprehend corporate growth and create additional growth-promoting tactics. There are numerous applications for big data;
Retail:
Retailers are increasingly using Big Data to identify customer behavior trends, evaluate a range of factors to determine optimal costing, and evaluate user engagement to provide a more individualized experience in the form of suggestions, targeted advertising, up-selling, and rewards programs, as well as to manage supply chain fluctuations as early as possible.
In order to forecast consumer behavior, online merchants and retailers utilize data from search histories, reviews online, shopping histories, and other resources.
Manufacturing:
To manage their supply networks, manufacturing organizations employ big data. Stock, purchasing, shipping, and returns are defined and forecasted using predictive analytics.
Banking:
Entire financial ecosystem is changing dramatically. Big data systems are used by financial services firms for risk management, real-time market data analysis, putting an end to fraud in its tracks, maximizing return on investment, obtaining operational excellence, and reducing hidden operational costs, thereby saving money and increasing productivity.
Health Care:
Modern healthcare management places emphasis on data analytics to improve patient treatment, lower healthcare delivery costs, and improve patient care operations. Big Data‘s contribution to the healthcare domain has grown significantly. It is gradually but steadily having a significant impact on the vast healthcare industry. It is now being used by providers and practice organizations for a variety of purposes;
- Provides up-to-date information on infectious disease threats or outbreaks to healthcare organizations and government agencies,
- Early symptom detection to avoid preventable diseases,
- Epidemic outbreak prediction and foreseeing problems such as emerging pandemics and drug interactions.
Why are Big Data and Big Data Analytics Important?
By looking at client profiles, a business may concentrate on what its consumers want, what demographics its paying customers belong to, and what demographic they fall into. They aid in the identification of patterns, the calculation of risk portfolios, and the detection of fraudulent behavior before serious damage is done.
Businesses can use outside intelligence to fine-tune their business strategies when making decisions. New systems created using Big Data technologies are replacing outdated systems for collecting customer feedback. Big Data and natural language methods are deployed to analyze and assess user reactions. Businesses should be able to tailor their products and marketing initiatives more effectively to customers’ (and potential customers’) needs to maximize satisfaction and repeat business. Big data analytics is critical because it;
- improves manufacturing, resources, or procurement/inventory planning,
- improves operations, make them more efficient,
- improves customer service and faster turnaround, increases user satisfaction, resulting in happier customers,
- develops a deeper understanding of current market conditions in order to create personalized marketing campaigns,
- offers valuable customer insights that businesses can use to improve their marketing, advertising, and promotions in order to increase customer engagement and conversion rates,
- simplifies resource/asset management,
- improves product development or creates and markets new products and services,
- generates new revenue or increases revenue and profit, and growth opportunities,
- allows for smarter business decisions,
- gains more complete answers because you have more information/approaches to problems in a completely different way,
- makes time faster, so, accelerates insight,
- ensures cost-effectiveness,
- makes cost reduction,
- supplies early identification of product/service risk,
- improves a more intuitive understanding of customer profiles and purchasing behavior allows a business to zero in on what their customers like and what demographic their paying customers belong to,
- supplies a more in-depth understanding of product popularity,
- gives sentiment meter, which gauges how customers feel about your company, service, or product,
- assists businesses in constantly innovating and redeveloping their products to remain competitive. They aid in determining the root cause of business failures, issues, and defects,
- aids in the detection of patterns, the calculation of risk portfolios, and the detection of fraudulent behavior before serious harm is done,
- analyze sales trends based on customer purchasing history,
- Improves relationships with customers, vendors, and suppliers,
- reduces order-to-delivery times,
- improves integration throughout their entire supply chain,
- improves strategic planning,
- gives shorter response time to supply chain issues.
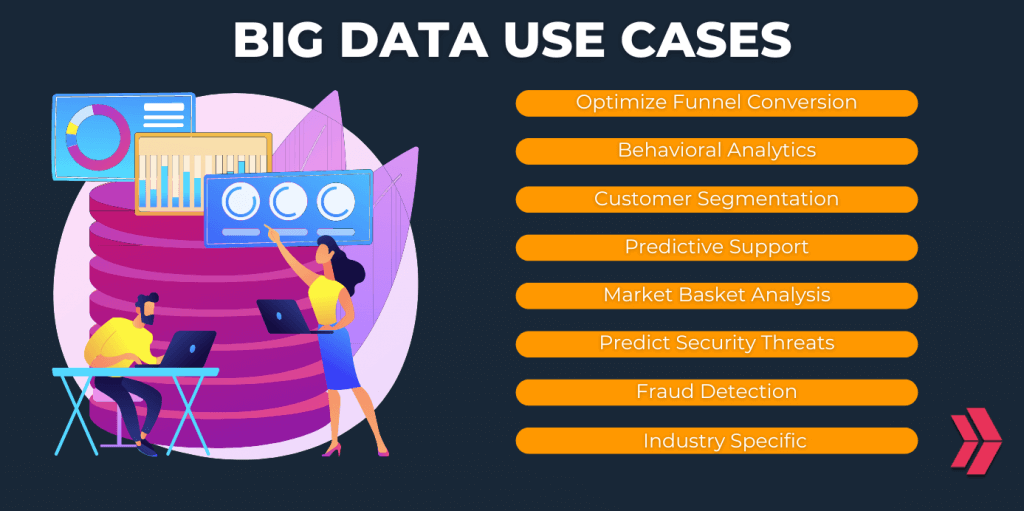
Big Data Use Cases
Big data can be explored and analyzed to gain information and insights, do better business and operational decisions, make better business strategies, and automate processes. The profound impact of big data on businesses across multiple industries;
- 360-degree customer view and improved business intelligence,
- More effective customer acquisition and retention,
- Improved fraud detection, and cybersecurity,
- More accurate forecasting and price optimization,
- Enhanced personalization and recommendation,
- AI-assisted content analysis of ‘dark data’,
- Preventive maintenance and assistance,
- Recognizing and mitigating potential hazards.
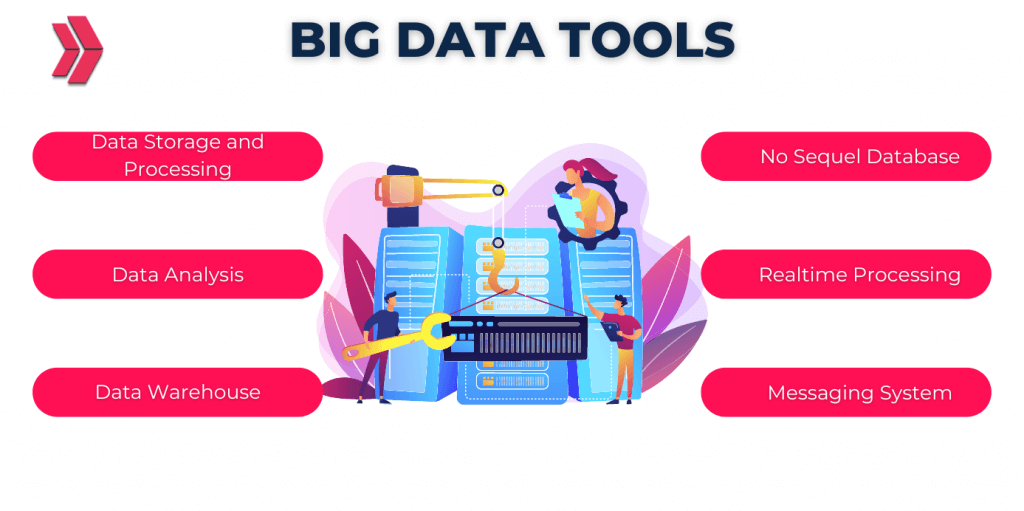
How does Big Data work?
Big data generates fresh insights, which in turn generates new possibilities and business models. The primary three steps are integrating, managing, and analyzing big data.
Integrate:
Big data combine information from numerous sources and applications. Inadequate traditional data integration techniques include extract, transform, and load (ETL). New methods and technologies are needed to analyze terabyte- or petabyte-sized large data sets. You should bring in the info, process it, and assure that it is prepared and available for usage by your analysts throughout the integration.
Manage:
Your options include a hybrid storage system, on-premises storage, or the cloud. You may use whatever processing needs and process engines you choose, and you can preserve your data in every form you desire. Many people select their storage solution based on where their data are currently stored. The cloud is steadily gaining popularity as it supports your current compute needs and lets you spin up resources as needed.
Analyze:
Your big data investment yields results when you examine and use your data. You’ll gain fresh perspectives by performing a visual analysis of your various data sets. I delve deeper into the data to uncover new information. Educate others about your discoveries. To construct data models, they employ machine learning and artificial intelligence.
How Does Big Data Analytics Work?
By gaining valuable insights from patient data, big data analytics can assist healthcare professionals in finding novel diagnoses and treatment options.
Big Data analytics analyze current data and predict the longer term using data processing, AI, and machine learning. The benefits of massive data analytics include making informed decisions for organizations, better risk management, and improved customer experience.
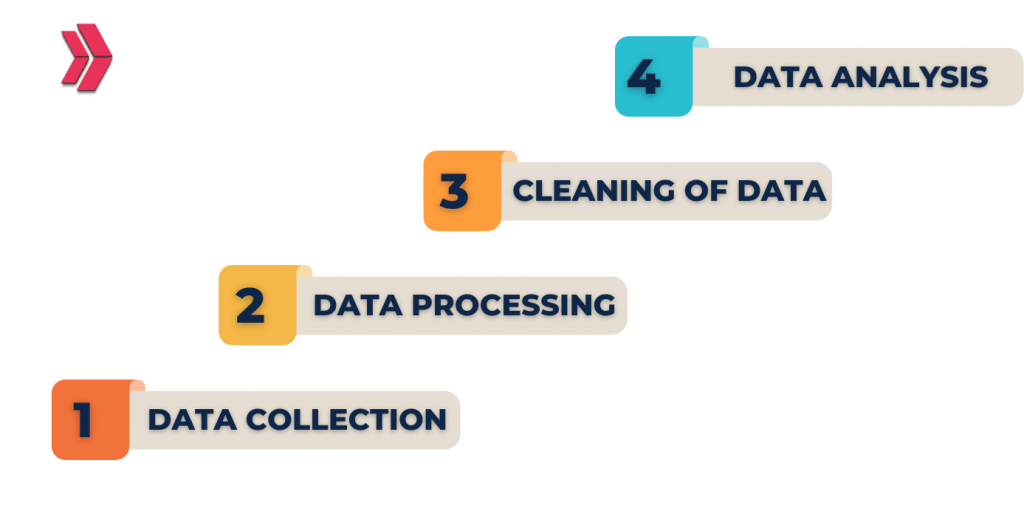
Now let’s discuss how big data analytics functions work:
Stage 1: Analysis of the Business Case
A business case establishes the aim and purpose of the analysis and is the first step in the big data analytics lifecycle.
Stage 2: Identifying Data Sources
Numerous data sources are discovered in this phase.
Stage 3: Data Filtering
At this stage, corrupt data is removed from all of the previously identified data.
Stage 4: Extracting of Data
Stage 4 involves extracting and then transforming data that is unsuitable for the application.
Stage 5: Data Aggregation
Data from various datasets that share the same fields is combined in stage five, data aggregation.
Stage 6: Analysis of Data
To uncover pertinent information, data is evaluated utilizing analytical and statistical methods.
Stage 7: Data visualization
Big data analysts can produce visual representations of their analysis using programs like Tableau, Power BI, and QlikView.
Stage 8: Final Analysis’s Outcome
The final analysis results are made accessible to business stakeholders at stage 8 of the Big Data analytics lifecycle so they can take the necessary action.
Challenges of Big Data
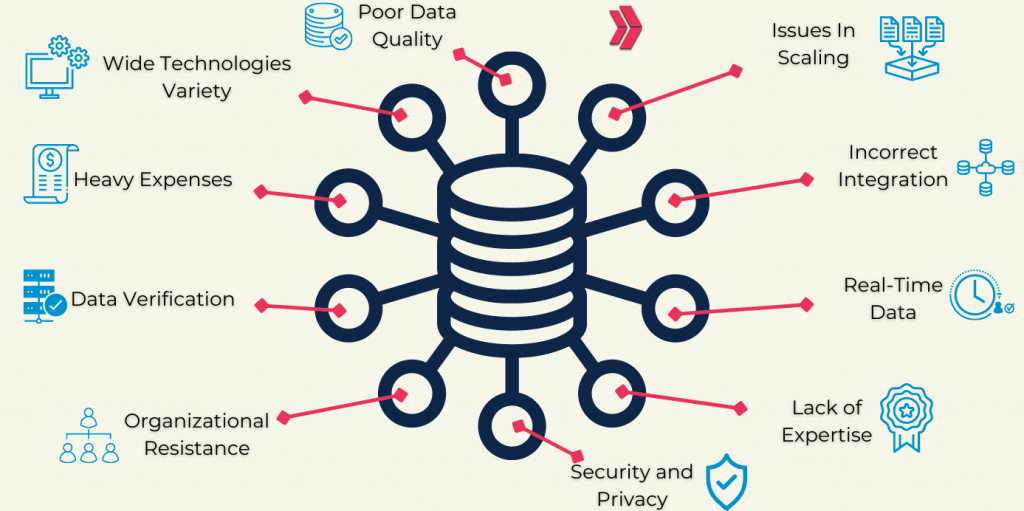
Despite the development of new data storage technologies, data volumes are doubling every two years. Curating and preparing data for use takes up 50% to 80% of the time that data scientists spend on it. It takes a lot of work to create clean data or data that is pertinent to the client and set up to allow for in-depth analysis. Organizations still struggle to manage their data and come up with efficient storage solutions. Five areas, in particular, are crucial in this process. These are;
Big Data Governance:
The challenges of data governance are complex, necessitating a combination of policies and technology. Organizations often create an internal team to create governance policies and processes. Additionally, they make investments in high-end data management solutions for data integration, quality control, and integrity management.
Leadership:
In the big data era, businesses succeed because they have more or better data and because their leadership teams have established clear objectives and success criteria. Big data‘s power does not replace the need for judgment or human insight. Companies that can do all this while changing how their organizations make decisions will be successful in the coming decade.
Big Data Security:
It’s crucial now more than ever to safeguard your data in light of the increase in data breaches. Your analytics system may experience security problems as it develops. Some of these worries can be reduced by encrypting your data, following security audits, and being cautious.
Big Data management:
Data volumes are still increasing, and a large portion of it is in unstructured data types, including speech, videos, social platforms, photographs, and inputs from mobile devices. These can be difficult to find and analyze, necessitating the use of sophisticated technologies such as AI and machine learning. MongoDB is a well-known big data solution because it can handle a variety of data formats.
Finding and Retaining the Simplest Big Data Talent:
As data become more affordable, data supplements become more valuable. Although statistics are important, many of the crucial methods for handling large amounts of data are rarely covered in statistics courses. Expertise in experimental design can assist in bridging the correlation-cause gap. The best data scientists are also fluent in business terminology.
Best Practices of Big Data in Today’s World
Amazon Prime makes programming recommendations based on Big Data analytics for individual users. Google famously demonstrated that it could forecast flu outbreaks based on when and where people searched for flu-related terms. Walmart uses real-time data from its point-of-sale system to manage pricing, inventory, and supply chain. PayPal decides what precautions it must take to protect its customers from fraudulent transactions.
What are Big Data Jobs?
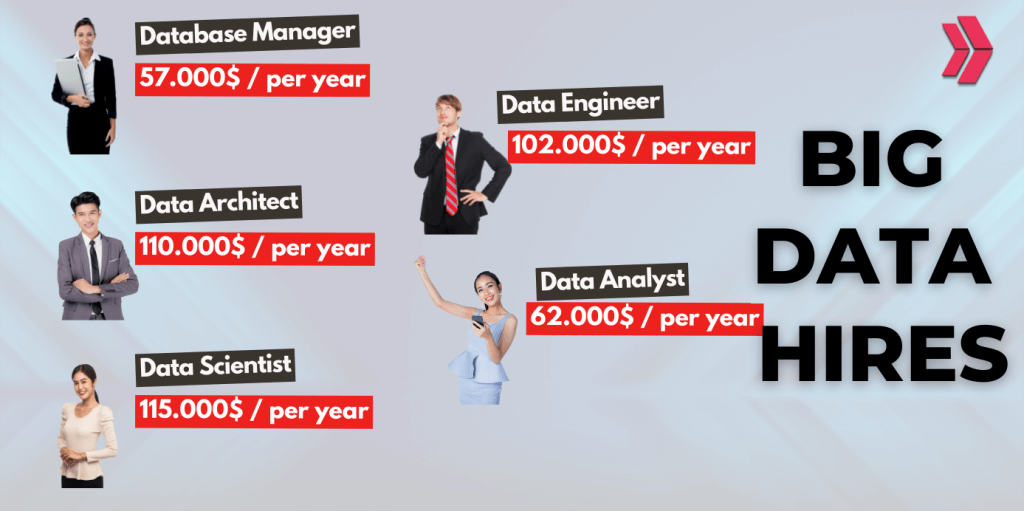
The Harvard Business Review dubbed the data scientist’s position as “the finest job of the twenty – first century” in October 2012. The demand for data scientists (and similar job titles) has skyrocketed. There are some jobs in big data. These are; Big Data Examiner, Database Manager, Big Data Analyst, Big Data Developer, Database Administrator, Security Engineer, Big Data Scientist, Data Architect, and Big Data Engineer. Let’s investigate what they are doing.
BIG DATA JOBS
| Job Name | Job Description | Average Salary |
| Big Data Examiner | similarly to a quality assurance (QA) analystputs data plans to the testcreates and runs test scriptsanalyzes data execution scriptsdefines and tracks quality assurance metrics | 83.626$ |
| Database Manager | requires a broad understanding of database technology accountable for management responsibilities | 62.621$ |
| Big Data Analyst | solves problems by analyzing data systemsregularly designs automated systemscreates reportsworks independently or as a part of a teamfamiliar with R, Python, HTML, SQL, C++, JavaScript | 90.442$ |
| Big Data Developer | Works same as a software developerfinishes application coding and programmingbuild and implement pipelineshelp with scalable web servicesconduct researchanalysis on solutions like data storage | 95.647$ |
| Database Administrator | Manages database every dayaccountable for database updates and modifications. | 79.245$ |
| Security Engineer | assists to scale risk exposuredesigns multi-layered network defense protocolsresponds to intrusion attemptsexamines security systemsdevelops and implements software update test plans | 93.993$ |
| Big Data Scientist | uses the knowledge to investigate and process datacollaborates closely with business executivesmines, analyzes, and interprets data | 118.905$ |
| Data Architect | develops business directions and database solutionswork with data engineers creates and tests new database prototypes | 115.413$ |
| Big Data Engineer | gone-between for data scientists and business executivesmake sure that data scientists’ work supports and aligns with the company’s overall goalsevaluates potential new data sourcescreates processes to boost data accessibilityprepares reportsdevelops computer algorithmscreates end-user tools and dashboards | 104.604$ |
Table-2: Big Data Job Names and Descriptions
Big Data Examiner:
A big data tester functions similarly to a high quality assurance (QA) analyst. In order to help with the delivery of data-related products, they put data plans to the test. They will create and run test scripts and analyze data execution scripts. Big data testers also define and track quality assurance measures like flaws and test outcomes. The common salary is 83.626$.
Database Manager:
Database managers are technical experts with a creative flair who is well-versed in database technology. They appear to be interested in project management duties and the database environment. A database manager is usually accountable for a large range of ordinary management responsibilities, like leading the information team, managing personnel issues, and adjusting budgets. The typical salary is 62.621$.
Big Data Analyst:
Data analysts solve problems by analyzing data systems. They regularly design automated systems that retrieve data from databases. Data analysts should collaborate with others or work alone to create reports frequently. Big Data analysts should be familiar with R, Python, HTML, SQL, C++, and JavaScript. The typical salary is 90.442$.
Big Data Developer:
A big data developer operates in a similar manner to a software developer. They complete application programming and coding and construct and put pipelines into use that extract, transform, and carry data into a finished good. A developer may aid even high-performance, scalable online services that track data. Some big data developers also conduct research and analysis on new solutions for issues like data storage and processing to make more streamlined approaches. The common salary is 95.647$.
Database Administrator:
Database administrators manage a company’s database every day. This entails maintaining database backups and guaranteeing the stability of the database. Database administrators are accountable for database updates and modifications. The typical salary is 79.245$.
Security Engineer:
Security engineers are essential in IT because they assist to scale back corporate risk exposure. They create many layers of network security mechanisms, such as installation. Security engineers examine security systems to spot problems and develop and implement software update test plans. The common salary is 93.993$.
Big Data Scientist:
Data scientists use their knowledge of technology, statistics, and arithmetic to investigate and process data, which is then wont to gather actionable insights like patterns and trends. Data scientists collaborate closely with business executives. They mine, analyze, and interpret data before presenting their findings to executives. Data scientists give suggestions in support of their insights and patterns to assist organizations in making better decisions. The average wage is 118.905$.
Data Architect:
By fusing inventiveness with knowledge of the overall database design, data architects create business strategies and database solutions. They work with data engineers to form data workflows that may assist the corporation in reaching its goals. Additionally, an information architect creates and tests new database prototypes. The average salary is 115.413$.
Big Data Engineer:
Big data engineering serves as a liaison between corporate leaders and data scientists. They ensure that the work of the information scientists supports and is in line with the broader objectives of the business. Big data engineers work with large amounts of data, evaluate potential new data sources, create processes to boost data accessibility, prepare reports, and develop computer algorithms for prototype code. They also create end-user tools and dashboards. The typical big data engineer’s salary is 104.604$.
Conclusion
As mentioned above, big data is in our daily life. As people and devices via IoT are also a part of big data. Because we create lots of raw data every day via watching/writing from Youtube, Facebook, Instagram, Netflix, etc. Learning data science will be very important for you if you own a business or planning to have a good career path. To learn the basics of data analytics, you may consider taking the Clarusway data analytics course from one of the best data science Bootcamps.

