It is tough to understand whether analyzing data is true or not for data analyst dummies. If you examine your dataset wrongly, your insight becomes wrong. Due to your lousy insight, you develop a bad strategy.

A bad strategy means losing money for a company. Therefore, you should check whether our analysis results are accurate or not. In this article, you will learn to match your analysis results using Python, SQL, and Tableau and try to get the same results.
There is a selling bicycle data in the SQL database in which there are nine brands, seven categories, and 321 products of bicycles. Time starts from 2018-01-01 to 2020-12-28. There are three stores total of 10 persons. We connect to the database, pull data, and analyze it using Python and Tableau. We also analyze data from the database using Microsoft SQL Server Management Studio.
1. Creating SQL Schema
First, we prepare the database schema beforehand, as shown in Table 1 below. The table shows the connection between the nine tables. It is based on a relational database management system (RDBMS).
There are nine tables. These table names are; product.brand, product.category, product.stock, sale.customer, sale.order_item, sale.orders, sale.staff, sale.store
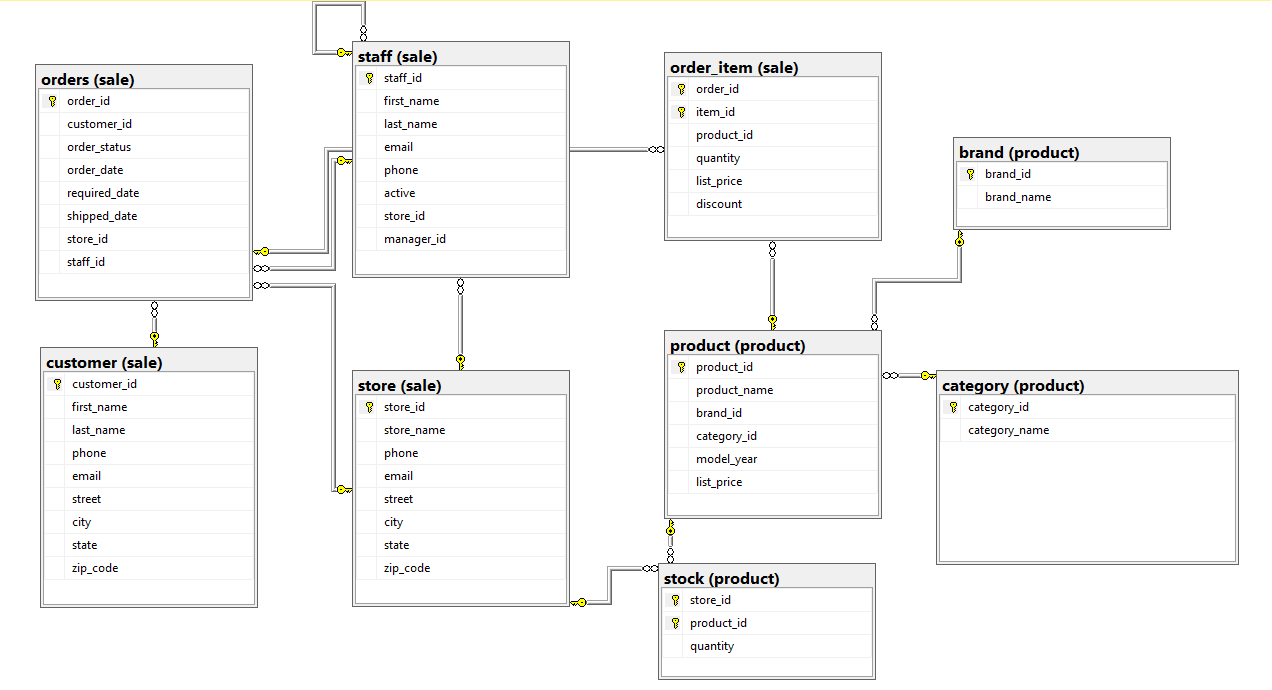
Table-1: Database Schema in Microsoft SQL Server Management Studio
2. Connection with Python
Now we connect to the database using python scripts. It is shown the steps of this phase below.
Step 1: Create a Python File as Jupyter Notebook
In this step, we create a new python file as Jupyter Notebook named “ConnectionToSQLServerWithPython.ipynb” which we save into
C:\Users\TOSHIBA\Desktop\CLARUSWAY\ML\MyProjects\SampleSales.

You may save your file wherever you want on your local drive.
Step 2: Import Pyodbc/Pandas in Our Python File
The next step is to import pyodbc and pandas modules in our Python file. It is one of the most favored languages all over the world. Open Database Connectivity (ODBC) is a database driver, and Pyodbc brings Python and ODBC together. Pandas is a powerful manipulation tool built on top of the Python programming language. You may learn more details about python from the https://pandas.pydata.org/.

Step 3: Regulate the Connection String
Now, we regulate our connection string. For this example, my driver should be the SQL Server version we use; here is SQL Server 2017. There are also SQL Server 2016/2014/2012 versions. Now, we connect to SQL Server as “localhost“ using Windows Authentication. Our main database which we connect to is “SampleSales“. Hence, we regulate our connection via ODBC Driver shown below:

Step 4: Execute SQL Query by Creating Cursor from Connection
In this step, we execute the SQL query by creating a cursor, as in the example below. We give just an example of a query below. It may change according to our analysis. We can see the code looks like this:

Step 5: Recall Inquiry Result from Cursor
In this phase, we use the cursor.fetchall() method to get the query results by using for loop from the cursor:

Step 6: Close Cursor/Connection
In this last phase, we close both cursor and connection to avoid leaving an open database. To do this, we write the below commands:

Step 7: Full Code of The Example
Below, we can find this example’s full code.

3. Connection to Database from Tableau
First, after opening Tableau, we should connect to Microsoft SQL Server. We should click the “More” button and select Microsoft SQL Server.

Table-2: Connecting to Microsoft SQL Server
After that, we see the page below. We should fill in the blanks about this page’s server name, database name, and authentication area. For the server name, we should write our computer’s name. We should note the database name we want to connect in the Microsoft SQL Server Management Studio for the database name. Here, we use the “SampleSales” database.
In the authentication area, there are two choices; one of them is “Use Windows Authentication (preferred),” and the other one is “Use a specific username and password.” Choose which one is appropriate for you. If you choose “Use Windows Authentication (preferred),” you can connect automatically. If you choose “Use a specific username and password” we should write our username and password to the area. Lastly, we should click the “Sign in” button.

Table-3: Connecting to Microsoft SQL Server Management Studio.
After that, we see a table shown below. There are the “SampleSales” database’s tables in the table.

Table-4: Tableau’s Data Source Page
These tables are the same as the Microsoft SQL Server Management Studio’s “SampleSales” database tables below.

Table-5: “SampleSales” database tables in Microsoft SQL Server Management Studio
After that, we join the tables with each other. We use the “relationships” method for this aim. It is important to join the tables like the database schema shown in Table 1.

Table-6: Joining The Tables With Each Other
4. Analyze Two Examples
Now, it is time to analyze. We want to show two examples. One is to analyze the “average product prices of the brands.” The other is “find average product price is more than 1000.”
Example 1: Analyze the average product prices of the brands
It may change the product prices year by year for a company due to many factors. As a company, we wonder how much they mean product prices for three years. We show the analysis results using Python, SQL, and Tableau, respectively.
Step-1: Show With Python
Now, we analyze the question with python. We write the query for the question to which we want to find the answer. Then, we find the answer via for loop. We see the products’ average prices. For example, the product named Trek’s mean product price is 2500. These results are shown in descending form.

Table-7: Analyze Results with Python
Step-2: Show with SQL
Now, we analyze the question with SQL. We write the query for the question to which we want to find the answer. Then, we find the answer under the query. We see the products’ average prices. For example, the product named Trek’s mean product price is 2500. As we see, its product price is the same as the result we get from the python result. These results are shown in descending form.

Table-8: Analyze Result With SQL
Step-3: Show With Tableau
Now, we analyze the question with Tableau. We use the product.brand and order_item tables. We use brand_id and brand_name columns from product.brand table and use the list_price column from the order_item table as seen in Table 9. We see the products’ average prices below. For example, the product named Trek’s mean product price is 2500. As we see, its product price is the same as the result we get from python and SQL results. These results are shown in descending form as python and SQL results.

Table-9: Analyze Result With Tableau
Example 2: Find Average Product Price Is More Than 1000
We suppose that we want to learn which brands are expensive for us. So, we find which products’ average price is more than 1000. We show the results of analyzing Python, SQL, and Tableau.
Step-1: Show With Python
Now, we analyze the question with python. We write the query for the question to which we want to find the answer. Then, we find the answer via for loop. We see the products average prices more than 1000. As a result, we see that there are three brands. For example, the product named Surly’s mean product price is 1331.

Table-10: Analyze Results with Python
Step-2: Show with SQL
Now, we analyze the question with SQL. We write the query for the question to which we want to find the answer. Then, we find the answer under the query. We see the products’ average prices are more than 1000. As a result, there are three brands with an average price of more than 1000. Their names are the same as the result we find via python.

Table-11: Analyze Result With SQL
Step-3: Show With Tableau
Now, we analyze the question with Tableau. We use product.brand and order_item tables again. We use brand_id and brand_name columns from product.brand table and use the list_price column from the order_item table as seen in Table 12. We see the products’ average prices more than 1000 below. For example, the product named Surly’s mean product price is 1332 rounded. As we see, there are three brands same as the result we get from python and SQL results. These results are shown in descending form as python and SQL results.
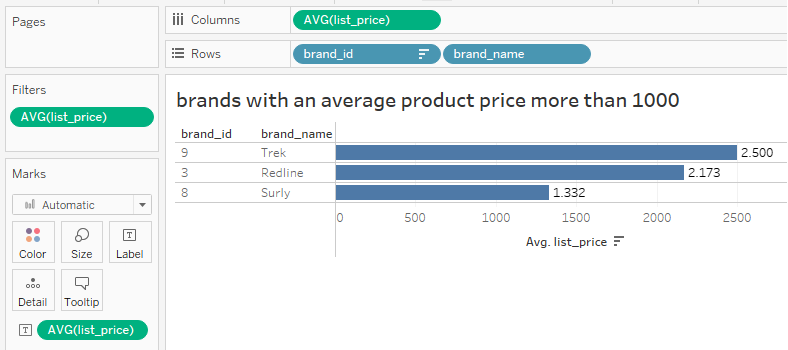
Table-12: Analyze Result With Tableau
5. Conclusion
It is very important for data analyst dummies whether they analyze data true or not. In this article, we analyzed the data using Python, SQL, and Tableau simultaneously and got the same results. Hence, we are sure that our analysis is true. You can analyze every dataset using this method told elbow and ensure your analysis results.